Jul 21, 2026
WNBA Prop Picks: Why you should ladder this prop in Mercury vs. Sparks [July 22, 2026]
Read Article Game lines and player props dominate the Dimers data, but there are near countless other markets where Dimers Pros can use our model's insights and we show you how.
Visit Dimers.com any given day of the week, and you'll find the best bets and player props of the day, featuring predictions for Moneylines, Spreads, and Totals and a wide variety of player prop markets across sports like the NBA, NHL, Tennis, Soccer, Golf, and more, all designed with the goal of beating the sportsbooks.
But, finding betting opportunities isn’t always about clicking the most obvious prediction on the board or featured when you log on to the Dimers App. While value hunters look for the top edges and strongest probabilities, others look for vulnerabilities in lesser-known markets.
In Dimers Pro, profitable betting can also come from applying the data in creative ways, even in markets you might not find on the surface in our predictions. However, by digging into all of features available on Dimers.com, you can uncover hidden opportunities.
To help you master the tools on Dimers, we show you three ways to apply the data in the NBA, Golf, and Soccer that you might not notice when browsing our best bets, predictions, and props.
Here’s how to do it.
The NBA props market goes well beyond standard points, rebounds, and assists lines, even in our NBA Projections Hub, where you'll find projections for those stats as well three-pointers, blocks, steals and even fantasy points.
Combo props like double-doubles and triple-doubles, as well as game leader markets (most points, rebounds, or assists in a game), often fly under the radar. While you won’t see a direct prediction for these markets, such as the probability of a player recording a double double, the data is sitting right there in the Hub. It's precisely how we found and cashed a +950 LeBron James triple double prop before the All-Star Break,
Who took the LeBron triple double?? 🤑
— Dimers (@DimersCom) February 13, 2026
Gets his first of the year, and the oldest to ever do it. https://t.co/BtOb7o5MME
With full access exclusive to Dimers Pros, our projections provide daily outlooks for every player. For example, if a player is projected for 18.3 points and 9.7 rebounds, that’s a clear “Double-Double Threat" as they are within striking distance of double digits in a second stat, and as our projections are averages of all simulations, that means that player has successfully recorded double digits in a number of them.
This same data-driven approach works beautifully for game leader markets.
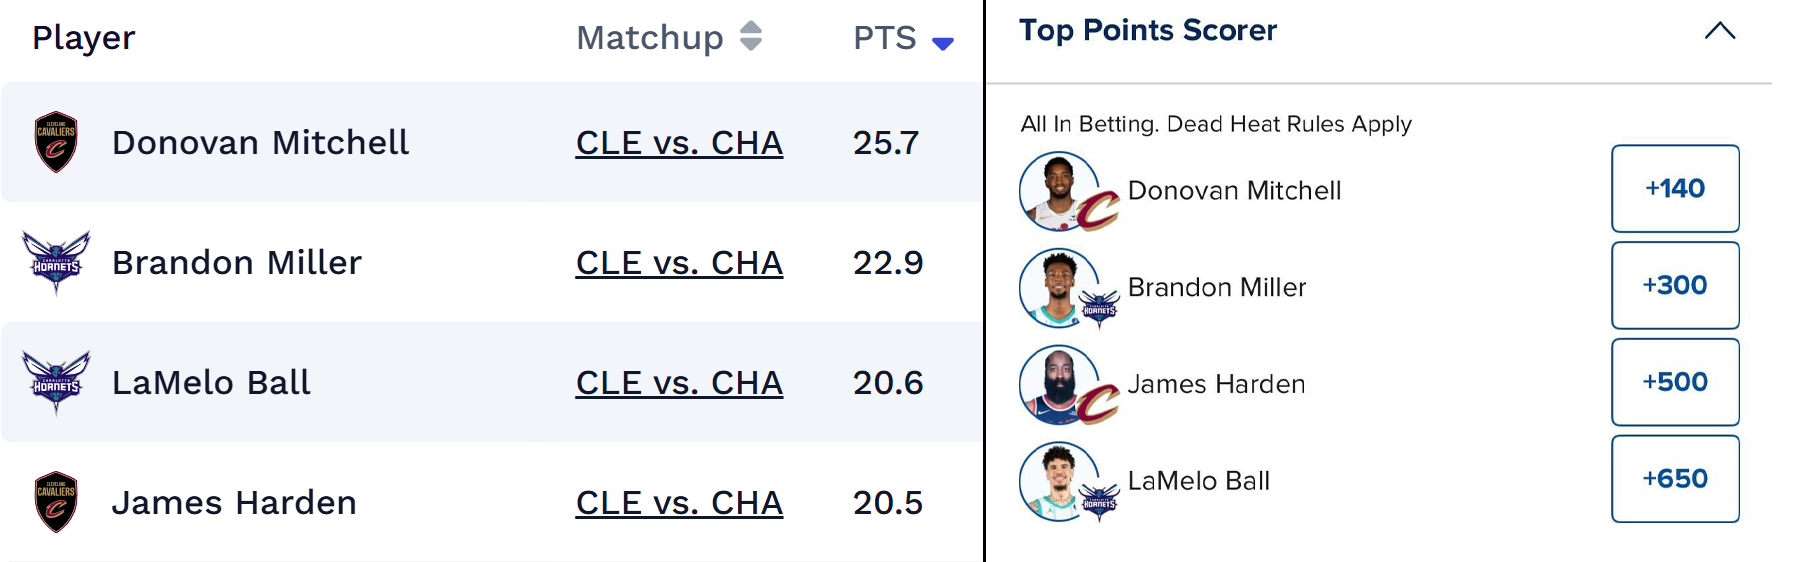 Dimers' top projected scores in Hornets-Cavaliers on Friday, Feb. 20, compared to FanDuel's odds for the top scorer in the game.
Rather than betting a player to climb a ladder or even hit their over, you can sort projections by points, rebounds, and assists to identify the model’s projected leaders. If two players are projected similarly atop the board, but have different odds, that discrepancy can be actionable.
Even better, players projected just behind the favorite may offer significantly longer odds despite being within striking distance statistically.
By shifting your focus from “Will they go over?” to “Can they lead?” you unlock a market where projection data can create serious leverage.
Golf betting markets go much deeper than outright winners and top finishes.
Two of the most overlooked opportunities are 3-ball matchups and regional group betting, and both can be tackled using the Dimers Head-to-Head Matchup Tool.
Dimers’ in-house simulation model allows you to compare any two golfers and see projected win probabilities for either Round 1 or the full 72-hole tournament - check out how we used this tool to build a parlay for the Genesis Invitational.
While the tool is built for head-to-head matchups between two golfers, you can reverse-engineer 3-ball groups by running each pairing within the trio. The golfer who projects strongest across both comparisons is, mathematically, the most likely to win the group.
For example:
Golfer A has a 60.2% chance to beat or tie Golfer B
Golfer A has a 61.7% chance to beat or tie Golfer C
Golfer B has a 58.6% chance to beat or tie Golfer C
Based on these results, you can see that Golfer A would have the advantage over both of the other two, providing insights into a three-ball market using two-man predictions.
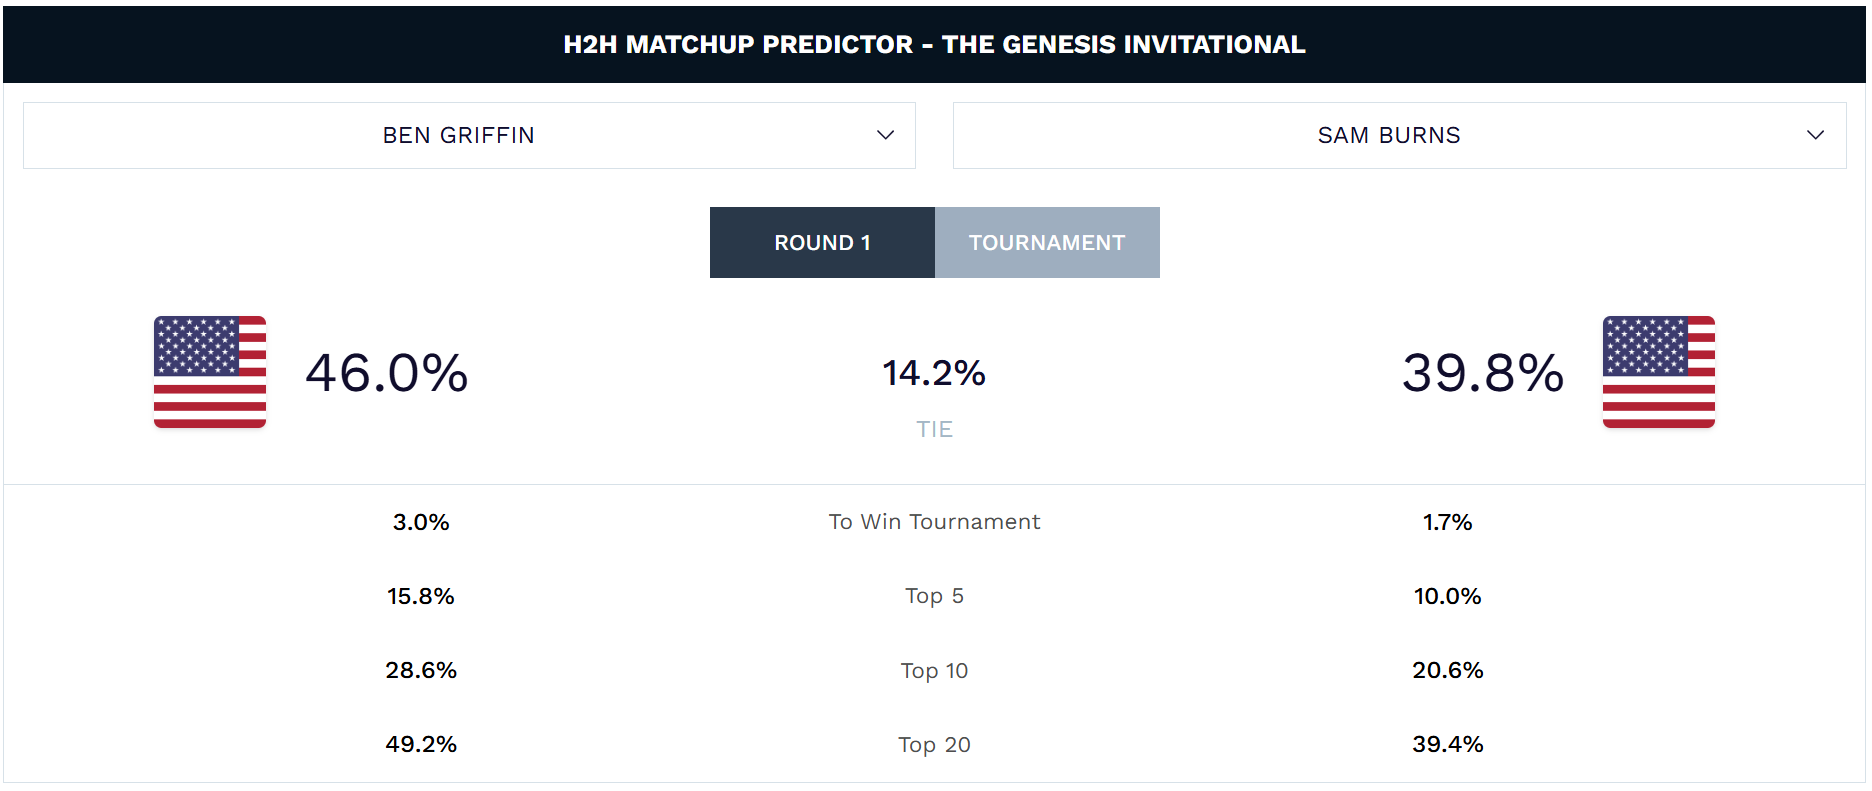 The H2H matchup results for Ben Griffin (Golfer A above) vs. Sam Burns (Golfer B above) for Round 1 at the Genesis Invitational.
This same method applies to regional markets such as top American, top European, or top Asian player.
These groups are often larger, so it may take several simulations with the Head-to-Head tool to find a player with a hidden advantage, but users can also get a look by scanning our full golf predictions, which display each golfer’s country of origin.
Doing so allows a user to quickly see how each golfer in a region stacks up against the rest, so even though Dimers doesn’t list a “Top USA Pick” directly, the model’s probabilities allow you to build that projection yourself.
In a sport where winning margins are razor-thin, leveraging matchup simulations in creative combinations can reveal more unique ways to gain an edge.
“Both Teams to Score” (BTTS) can be among the most popular soccer betting markets, but it’s rarely highlighted alongside traditional moneylines or game totals. That doesn’t mean the edge isn’t there, it just requires a little math!
Dimers’ soccer models provide predictions for Moneyline (Home/Draw/Away), total goals, and detailed correct score probability grids. These correct score tables show the probability of every realistic outcome with at least a 1% chance of occurring, are where users can extract a number of insights beyond just winners and totals.
By adding together all projected scorelines where one team scores zero (e.g., 1-0, 2-0, 3-0, 0-0, 0-1, 0-2, etc.), you can calculate the model’s implied probability for “Both Teams to Score — No.”
Then, subtract that total from 100%, and you have the model’s projected probability for “BTTS — Yes.” Note that totals may add up to 1-2% under 100%, accounting for a handful of scores with under a 1% probability of occurring.
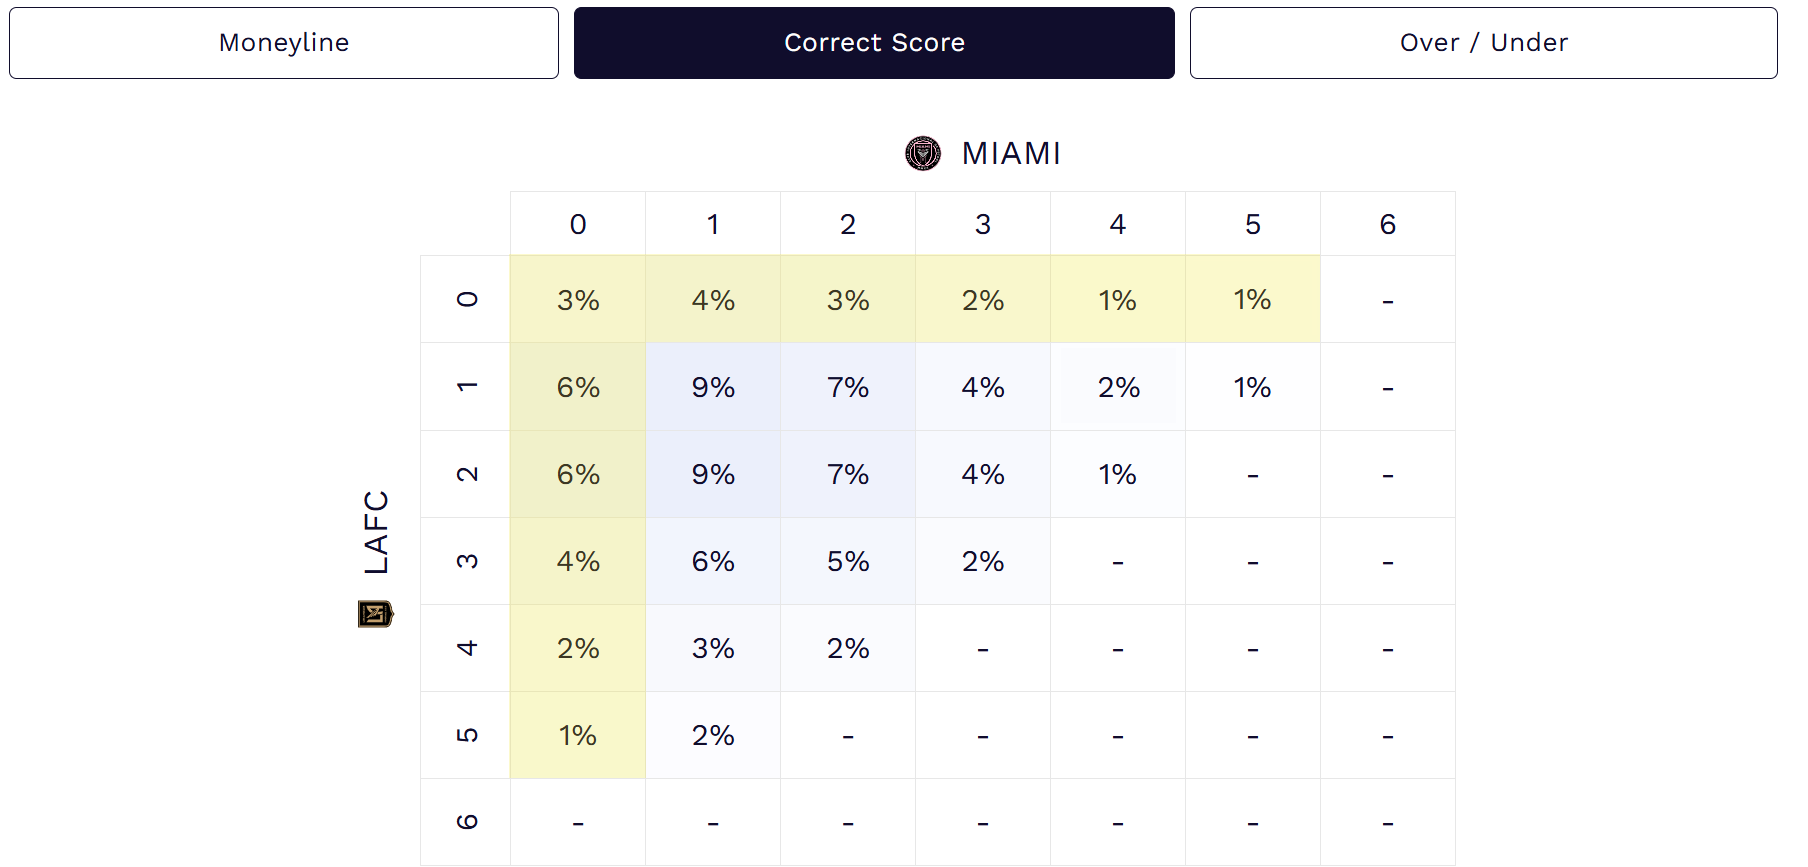 Dimers' correct score grid for Inter Miami vs. LAFC in MLS on Saturday, Feb. 21
You can see in the correct score grid above, we've highlighted each score where one team holds a clean sheet, resulting in a 33% chance of "Both Teams to Score - No", implying a 67% probability of both squads picking up a goal.
This process is powerful because it uses granular scoring projections rather than broad goal totals. For example, a match projected to go over 2.5 total goals doesn’t imply both teams will score, even if it's a closely-projected contest.
The correct score grid - also available for the upcoming FIFA World Cup - might heavily weight 2-0 and 3-0 results, signaling defensive imbalance rather than mutual scoring. By reconstructing the BTTS probability from the score grids, you gain a sharper understanding of how the model expects goals to be distributed and whether sportsbooks are mispricing the market.
These "hidden" markets aren’t really hidden; they only require a different lens.
Whether it’s identifying NBA stat leaders through projections, reverse-engineering golf 3-ball winners through head-to-head simulations, or building a BTTS probability from soccer correct score grids, Dimers’ data tools allow bettors to go beyond surface-level picks. The insights are there; you just have to know how to extract them.
Remember to please gamble responsibly. If you sense that you're taking your luck too far, know when to call it quits and don't be afraid to seek assistance. Keep in mind that gambling is all about having a fantastic experience! If you or someone you know is grappling with gambling issues, reach out to 1-800-GAMBLER for crisis counseling and support.

Dave Garofolo uses sophisticated AI-driven analytics to make predictions and evaluate player performances in the NBA, MLB, NFL, NHL, NCAAM, and PGA TOUR tournaments, crafting insightful game and prop previews.