Sep 17, 2026
For Free? Say No More. How Far Americans Will Go For Freebies
Read Article 
The 2026 World Cup's impact on American gambling habits will likely linger long after the final whistle.

Hosting the 2026 World Cup kicked off an incredible wave of soccer betting in America. According to a July 2026 study conducted by Dimers, 68% of Americans who bet regularly placed at least one wager during the tournament. For 1 in 6, it was their first time placing a sports bet.
The study "Heart vs. Data Index 2026: Did Americans Bet with Their Hearts or the Data During the World Cup?" looked into how Americans chose their bets: trusting their gut, taking advice from friends and family, following social media touts, or relying on predictive models, data, and stats.
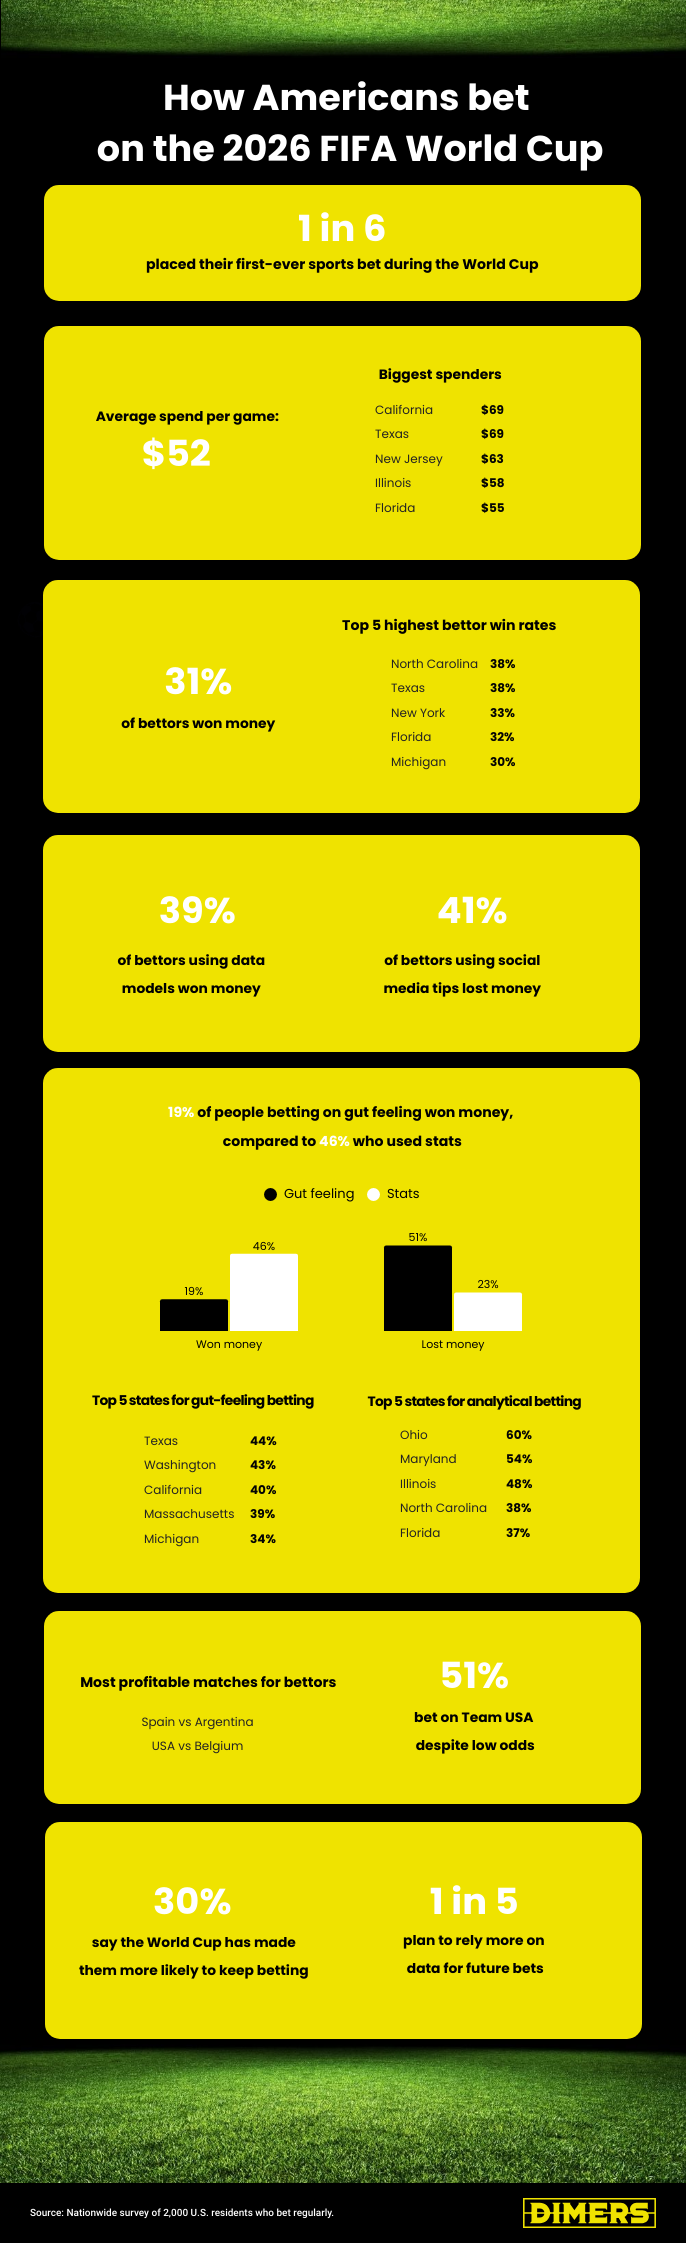
The World Cup didn't just bring in new viewers—it introduced millions of Americans to soccer betting sites. Among those who placed a wager, 61% had never bet on a soccer match before. For 17%, it was their very first time placing any sports wager.
On average, Americans spent $52 per game.
California and Texas tied for the top spot, with fans spending 33% more per match than the national average of $52. In fact, 5 states averaged higher spend per game than the national average:
The tournament highlighted just how much national pride can influence financial decisions. 51% of bettors backed the United States even when predictive models and oddsmakers made them heavy underdogs.
1 in 8 admitted to doing this multiple times throughout the tournament. It’s "Patriotism Tax"—the financial price fans pay when backing their home team despite the odds.
Even analytical bettors weren't immune. 55% of bettors who used data models still placed at least one wager on Team USA despite the unfavorable odds.
The survey revealed two distinct camps: "Heart Bettors", who relied on gut feelings and personal advice, and “Analytical Bettors”, who used probabilities, stats, and predictive models. 29% admitted they picked their bets based on instinct or recommendations from friends and family.
However, those gut-driven decisions often led to blown budgets. Almost 1 in 4 of emotion-led bettors spent more than planned, compared to 19% of analysis-focused bettors. The states with the highest percentage of gut-feeling betting:
Despite delivering far better results, only 16% of bettors used analytical models—such as those provided by Dimers—to guide their wagers. The top states for analytical betting were:
Another group turned to platforms like TikTok, X, Discord, and YouTube for picks. But the data shows that taking advice from social media influencers was one of the worst strategies of the tournament: 41% of bettors who relied on social media lost money.
These tout-reliant bettors wagered more than the national average, topping $55 per match and suffering losses 7 times more often than other groups.
Social media touts were most popular among bettors in Florida, Texas, New York, California, Michigan, Ohio, Georgia, and Illinois.
After the tournament, 28% of bettors who followed social media touts said they plan to switch to a data-driven approach.
Overall, about 31% of World Cup bettors finished the tournament in profit. The top five states with the highest percentage of winning bettors were:
The study's verdict is clear: 51% of gut-feeling bettors lost money, compared to 24% of those who trusted the math — while only 19% turned a profit, compared with 46% who won money among the data-driven crowd.
Despite delivering far better results, only 16% of bettors used analytical models—such as those provided by Dimers—to guide their wagers. The top states for analytical betting were:
The FIFA World Cup's impact on American gambling habits will likely linger long after the final whistle. 30% of respondents say the tournament made them more likely to bet on sports in the future. More importantly, it changed how they plan to bet. 1 in 5 bettors (21%) plan to use more stats, models, and analytics for upcoming sports seasons.
On 20th July 2026, Dimers surveyed 2,000 U.S. adults who bet regularly to analyze betting behavior during the 2026 FIFA World Cup. The sample included men (50%), women (49%), and non-binary (1%) respondents, with an average age of 38 years. Respondents were surveyed on their wagering frequency, average spend per match, decision-making sources, and overall financial outcomes. Data was cross-referenced to compare the performance of gut-feeling bettors, social media tipster followers, and users of predictive data models (not to be confused with prediction market apps). State-by-state breakdowns were also mapped to identify regional spending habits, emotional betting levels, analytics adoption, and net profit rates. The following states were excluded from the study due to insufficient data: Louisiana, Mississippi, Arkansas, Hawaii, Utah, Vermont, Maine, Montana, Nebraska, North Dakota, New Hampshire, New Mexico, Idaho, Rhode Island, Alaska, South Dakota, Wyoming.

For articles with several contributors, we use this author profile. This profile is also used for new sportsbook promos and offers. Our contributors' level of experience spans all sports and bet types. We hope we have you covered, no matter what you're betting on.